So you decided to invest your hard-earned money, and now you want to evaluate whether it was the right decision. To do so, you need to calculate the Alpha of your portfolio.
How to calculate Alpha of your portfolio
But before we immediately dive into the nitty-gritty of the Alpha formula, let us define the Alpha first.
What is Alpha?
Alpha or Jensen Index (invented by Michael Jensen in the 1970s) is an index used in some financial models such as the capital asset pricing model (CAPM) to determine the highest possible return on an investment for the least amount of risk.
In other words, Alpha measures how well an investment performed compared to its benchmark.
In finance, Jensen’s index determines the required excess return of a stock, security, or portfolio. It uses a relationship between risk and return (technically called “security market line”) as a benchmark.
The number you get shows how much better or worse an investment performed relative to its benchmark.
Thus, it allows the investor to statistically test whether the portfolio produced an abnormal return relative to the overall capital market i.e. whether the manager’s skill has added value to a fund on a risk-adjusted basis. Bluntly speaking, it tells you if investment decisions were good or bad.
However, Jensen’s Alpha causes some debates, as some economists argue that most managers fail to beat the market over the long run due to the efficient market hypothesis, attributing Alpha to luck instead of portfolio managers’ skills.
How does it work?
Mathematically speaking, Alpha is the rate of return that exceeds a financial expectation. We will use the CAPM formula as an example to illustrate how Alpha works exactly:
r = Rf + beta * (Rm – Rf ) + Alpha
Thus,
Alpha = r – Rf – beta * (Rm – Rf )
where:
r = the security’s or portfolio’s return
Rf = the risk-free rate of return
beta = systemic risk of a portfolio (the security’s or portfolio’s price volatility relative to the overall market)
Rm = the market return
Now we will have a look at three different scenarios of market performance accompanied by the diagrams. In all the scenarios, the excess returns on the fund are plotted against the excess returns on the market.
First Market Scenario

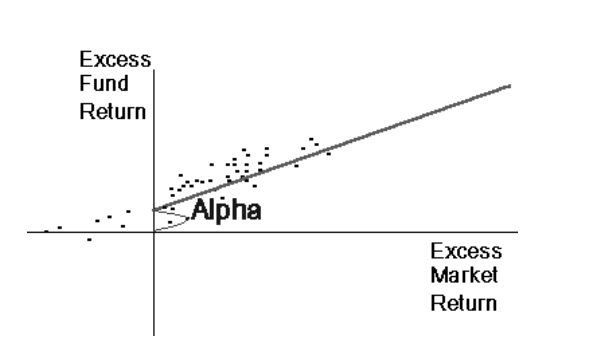
The excess returns on the fund are plotted against the excess returns on the market as shown above. The regression line in the first scenario has a positive intercept. This is an abnormal performance.
Interpretation: the funds (represented as dots) above the line performed better than the market.
Second Market Scenario

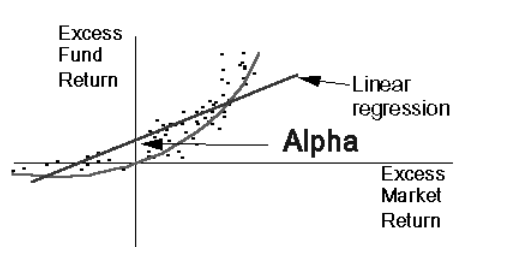
The second scenario shows what is known as market timing.
If the portfolio manager knows when the stock market is going up, s/he will shift into high beta stocks. If the portfolio manager knows the market is going down, he will switch to a low beta market. In the high beta stocks, these stocks will go up even further than the market and in the case of low beta stocks, these stocks will go down less than the market.
In this case, Alpha is positive, signalling strong performance.
Interpretation: If the stock is expected to be bearish, low-beta stocks will produce lower returns but also smaller losses, and vice versa when the stock is anticipated to turn bullish.
RECOMMENDED: Become 10x better at investing: try AG Insights, our investment research product, for free!
Third Market Scenario

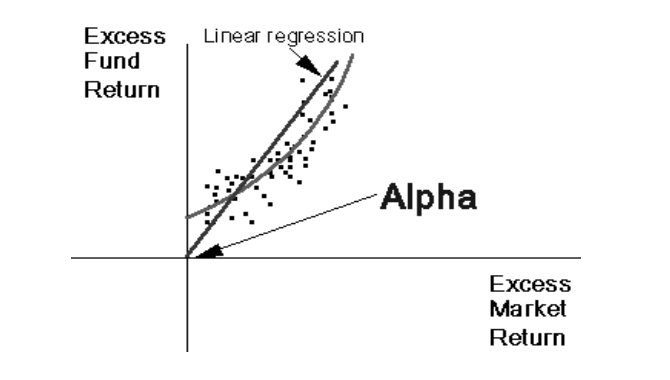
The third scenario assumes that the fund manager has an outstanding sense of market timing as in this case, his portfolio does not have negative returns at all.
In this case, the fund goes up by more than the market, yet the Jensen measure/Alpha, in this case, is negative. Even though the manager has shown strong market timing skills, the performance evaluation criterion reveals that he is not doing a superior job as Alpha is negative.
Interpretation: this is a classic example of when the interpretation of Alpha should be put into the context within which a fund manager operates.
To sum up, Alpha can be a useful tool to estimate the performance of a stock or your entire portfolio, yet it is important to look at it from the market and investment thesis perspectives.
If you enjoyed the article, I’d like to invite you to try out AG Insights, a subscription with researched investment ideas. Every month we will send you a report with 2 well-researched investment opportunities that can generate 15-20% per year. You can try our reports 30 days for FREE!
For more life-changing opportunities and tips on entrepreneurship and finance, subscribe to our weekly newsletter and follow us on X, Facebook, Instagram, and LinkedIn.


There is an error in the alpha formula, here is the correct one :
Alpha = r – Rf + beta * (Rm – Rf )
Hello Florian,
Thanks for dropping us a line. The formula in the article is correct.
Here’s another reference point:
https://www.m1finance.com/articles-2/capm-capital-asset-pricing-model/
Hope this info helps!
@Arthur Gopak,
Florian is right, your formula is absolutely wrong.
With your formula Alpha wil always be ZERO. Prove me wrong.
Hello Venkatesh,
Thanks for stopping by and leaving a comment.
Your statement makes no sense because it contradicts what Alpha stands for. Alpha is an excess return of Capital Asset Pricing Model (CAPM), also known as Cost of Capital.
I’m not sure exactly how you ended up with zero, but I will illustrate the math logic with the images below:
I hope these explanations will resolve the confusion.
Cheers,
Thank you for the insightful article!
Hi Jamie,
You’re very welcome!
Cheers,
Arthur
Thank you for the helpful article.
Hi Fred,
Thanks for stopping by!
Our team is happy to hear that you enjoyed our article.
For more investment topics, feel free to check out our investment research newsletter AG Insights.
Cheers,
Arthur
Thanks for the publication, I found it insightful.
Hi Andre,
Thank you for your kind words. Our team is happy to hear you found the article helpful.
If you want to become better at investing, check out our investment research newsletter – AG Insights. We release it every month and you get 30 days to try it out for FREE.
Cheers,
Arthur
This is such a well-researched and informative article! I love how you’ve compiled the best finance websites in one place. Super helpful!
Hi Jamie,
Thank you for your support.
The pleasure is ours.
If you want to become better at investing, check out our investment research newsletter – AG Insights. We release it every month and you get 30 days to try it out for FREE.
Cheers,
Arthur
í’ve been looking for a reliable list like this. thank you! Now I have some great new finance websites to explore
Hi Freddie,
Thanks for stopping by. We’re happy to hear you’re enjoying our content!
If you want to become better at investing, you might want to have a look at our investment research newsletter – AG Insights. We release it every month and you get 30 days to try it out for FREE.
Cheers,
Arthur
Hi, thanks for the article! I’m bookmarking this right away! These websites will be a game-changer for my financial planning.
Greetings from Canada!
Hi Raphael,
You’re very welcome!
If you want to become better at investing, check out our investment research newsletter – AG Insights. Every month, we release a report with 2 researched companies that can make 15-20% a year. For 30 days, you can try it out our report for FREE.
Cheers,
Arthur
Your article saved me hours of research! These are exactly the kinds of resources I was looking for.
Hi Andre,
Thanks for stopping by! Feel free to check AlphaGamma more often for more insightful content.
On another note: if you want to become better at investing, check out our investment research newsletter – AG Insights. Every month, we release a report with 2 researched companies that can make 15-20% a year. For 30 days, you can try it out our report for FREE.
Cheers,
Arthur
Thanks for sharing the article. Do you have any reviews of the trading tools as well?
Hello Aziz,
Thanks for your kind words!
Yes, we do! You might want to check out our overview with the best trading tools you can use in your trading and ways to find the best online broker to open an account with.
Additionally, if you want to become better at investing, check out our investment research newsletter – AG Insights. Every month, we release a report with 2 researched companies that can make 15-20% a year. For 30 days, you can try it out our report for FREE.
Cheers,
Arthur
Love it!
Thanks, Adrian, and you’re very welcome!
If you want to become better at investing, check out our investment research newsletter – AG Insights. Every month, we release a report with 2 researched companies that can make 15-20% a year. For 30 days, you can try it out our report for FREE.
Cheers,
Arthur
Thank you for the content. I’m new to finance, so I find this post useful. Keep it up!!
– Steve
Hi Steve, thanks for the kind wishes. Good luck on your journey in finance!
If you want to become better at investing, check out our investment research newsletter – AG Insights. Every month, we release a report with 2 researched companies that can make 15-20% a year. For 30 days, you can try it out our report for FREE.
Cheers,
Arthur
Great content!
Hi Raphael,
Thanks for your feedback! Feel free to check AlphaGamma frequently for more insightful content.
On another note: if you want to become better at investing, check out our investment research newsletter – AG Insights. Every month, we release a report with 2 researched companies that can make 15-20% a year. For 30 days, you can try it out our report for FREE.
Cheers,
Arthur
Thanks for the article. Keep up the great work.
Hello Benedict,
You’re more than welcome. Feel free to check AlphaGamma regularly for more updates.
If you want to become better at investing, check out our investment research newsletter – AG Insights. Every month, we release a report with 2 researched companies that can make 15-20% a year. For 30 days, you can try it out our report for FREE.
Cheers,
Arthur